The User-Friendly Omics Analyzer Anyone Could Use
Sequencing technologies have advanced tremendously since the development of Sanger sequencing by Fred Sanger and colleagues in the 1970s. The rise of second-generation and third generation sequencing technologies that were more efficient, powerful, and affordable gave birth to a ‘genomics revolution’. (1,2) What would have cost $100,000,000 to sequence a whole genome in 2001, costs as little as $1,000 twenty years later. (3)
Researchers in academia and in various industries, from health to biofuels, can take advantage of this vast sequencing data to facilitate their goals in new ways. Alas, a sequence is only a sequence. A string of nucleotide bases billions in length. It is how we analyze and interpret the sequence that makes all the difference between failure and innovation.
Barriers to Sequencing Analysis
How do you make sense of millions of strings of nucleotide bases? Sequencing data, or omics data, is analyzed through bioinformatics to draw conclusions from experiments. Bioinformatics is the application of computational tools (e.g., software) that collect, store, analyze, and distribute large and complex data sets. (4) It can also refer to the interdisciplinary field of study that develops such methods and tools. (4)
In order to fully interpret sequencing data, which indeed is large and complex, bioinformatics is indispensable. However, bioinformatic analysis is impeded by a steep learning-curve of learning programming language, assembling workflows, and juggling multiple applications. Further, outsourcing analysis to bioinformatic cores or vendors may rapidly incur a hefty price while leaving you removed from your own data.
There are a few free or low-cost platforms available such as ShinyGO, Terra, and DAVID with varying degrees of analysis capabilities. The responsibility of filtering genes of significance, checking for updated gene annotations, and choosing the appropriate analysis (workflows) are then passed onto you. Regardless of the minimal costs, these software platforms still require a familiarity with bioinformatics and may not be intuitive to navigate. This points to a larger problem within life sciences higher education: lack of bioinformatics training.
The Missing Training
I did my PhD in Biomedical Sciences at Temple University. The lectures touching on bioinformatics were a small fraction of a larger course I took one semester during my 6 years. At the time I thought nothing of it. Upon reflection, it was something I would have wanted more of as I went on to carry out my thesis research that involved microRNAs. My laboratory experience would be characterized as “wet lab”, focused on biological samples and experiments involving liquids. This contrasts with a “dry lab” that is focused on applied computational or mathematical methods (aka: bioinformatics). Realizing I was now completely removed from the process, I relied on LCSciences to complete my microRNA sequencing and analysis. I received a fixed report that LCSciences created for me. I was unaware of how much more I could have extracted from the data that I submitted to them. After talking to my peers, I learned I wasn't alone in this experience.
Unless you are specifically enrolled in a bioinformatics program or concentration, your pre-doctoral training might skim or completely omit bioinformatics that has become so integrated in biomedical and life sciences research. While perusing the available courses of some of the top Biomedical Science PhD programs (according to CollegeFactual.com), I observed science and laboratory courses are robust, while big data analysis courses tended to be scarce or absent. Some exceptions like Harvard and Princeton did offer full courses in computational biology and/or bioinformatics within their biological and biomedical PhD programs should students elect to take them. This lack of training is compounded when professionals accomplished in bioinformatics go on to teach at the lowest rate.⁵ While beyond the scope of this post, Williams et al. and Attwood et al. have addressed the obstacles integrating bioinformatics training into higher education and characterized such gaps in knowledge globally, respectively. (5,6)
Extracting What Matters From Your Data
As research continues to embrace a systems biology approach using omics techniques, you need accessible solutions now. In the face of today’s challenges in bioinformatics education, how can you move forward with extracting what matters from your data? How will you let your lab and peers know of your exciting result? How will you present your data at the next presentation or conference? What will your figures look like in your next publication?
At Trovomics, we appreciate that not only is it important to understand the conclusions of your own omics experiment, but it is equally essential to communicate those conclusions. Human eyes have a tremendous power to process and extract conceptional information with incredible speed, as little as 13 milliseconds. (7) With 65% of the population being visual learners, how others see your data is important. (8) Trovomics believes that visualizations are the backbone of communicating omics analysis results.
Trovomics Features Interactive and Customizable Visualizations
Extracting insights from your data shouldn’t be like pulling teeth. Obtaining graphs shouldn’t be like a scavenger hunt, scouring the web for tutorials and scripts. That is why Rajant Health Incorporated (RHI) created Trovomics: a user-friendly, automatic, and intuitive platform for your omics analysis needs. Other platforms may burden you with large data tables to scroll through. There may be multiple panels within the same page — all with different content, complicating the user experience. Graphs from other platforms may only be downloadable as is, or with limited design capabilities.
With Trovomics, you have full control over the important parameters and steps in the process and can tailor your analysis setup to each individual dataset. Our interactive platform lets you explore your data through visualizations that you can customize in real time. The platform is streamlined and modern, allowing you to focus on the important aspects of your data. All without touching the underlying code! You can select how you want to view your analysis from a variety of graphical options (e.g. Comparison, Gene Ontology, Volcano plot etc). Regardless of your choice, the graphs representing your data are the main feature, not an afterthought. (If you miss scrolling through long tables of omics data, don’t worry we still have those too!)
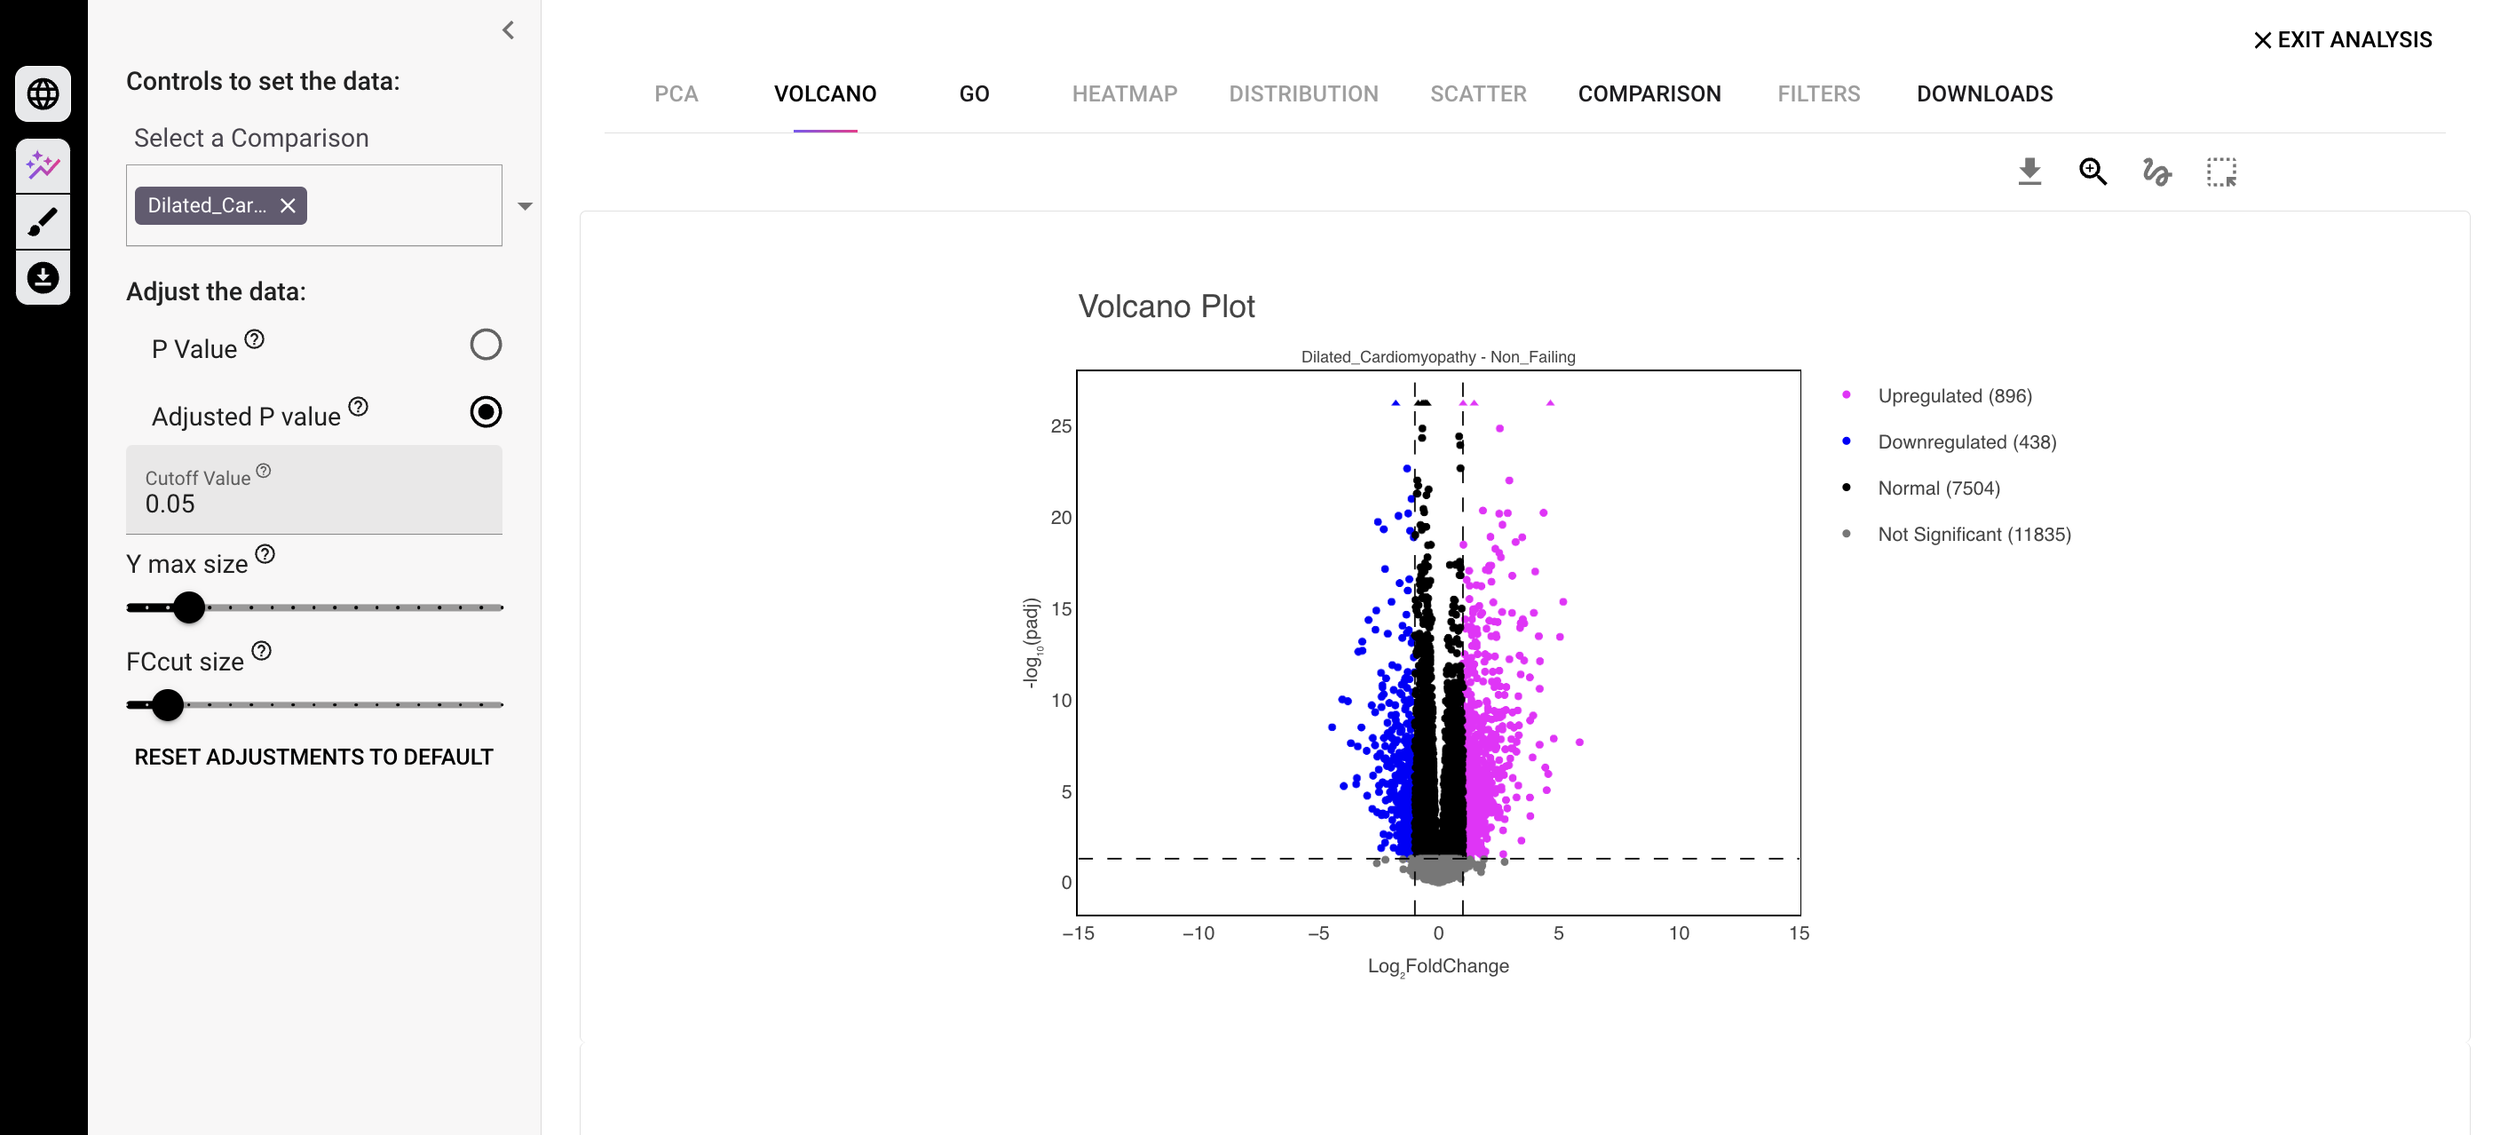
Screenshot of the Volcano plot and customizable parameters within the Trovomics visualizer showing RNA-Seq data from dilated cardiomyopathy vs non-failing samples.
Trovomics to Accelerate Your Research
RHI and Trovomics aim to dramatically accelerate research involving omics data. Omics can feel overwhelming and daunting, but we want to make it understandable and near effortless for everyone. Therefore, Trovomics is dedicated to improving bioinformatics education to help bridge the gap.
Our Help Center is stocked with FAQs, tutorials, other bioinformatics resources that will not only guide you through Trovomics, but strengthen your bioinformatics knowledge. We also have our team of computational biologists on stand-by, ready to assist with any of your experiments in Trovomics.
Revolutionizing health discovery isn’t just to benefit the scientists, but ultimately for everyone to live better and healthier lives.
Trovomics is a modern and intuitive platform that transforms your omics data into highly interactive and customizable visualizations to extract the most pertinent results, all within 48 hours.* Click below to create a free Demo account or subscribe to get started with your own data analytics and visualizations!
*Processing time may be affected by the volume, complexity, and quality of the data submitted for analysis.
References
Heather, J.M. & Chain, B. The sequence of sequencers: The history of sequencing DNA. Genomics 107, 1-8 (2016).
Wang, Y., Zhao, Y., Bollas, A., Wang, Y. & Au, K.F. Nanopore sequencing technology, bioinformatics and applications. Nat Biotechnol 39, 1348-1365 (2021).
Wetterstrand, K. DNA Sequencing Costs: Data from the NHGRI Genome Sequencing Program (GSP)
Bayat, A. Science, medicine, and the future: Bioinformatics. BMJ 324, 1018-1022 (2002).
Williams, J.J., et al. Barriers to integration of bioinformatics into undergraduate life sciences education: A national study of US life sciences faculty uncover significant barriers to integrating bioinformatics into undergraduate instruction. PLoS One 14, e0224288 (2019).
Attwood, T.K., Blackford, S., Brazas, M.D., Davies, A. & Schneider, M.V. A global perspective on evolving bioinformatics and data science training needs. Brief Bioinform 20, 398-404 (2019).
Potter, M.C., Wyble, B., Hagmann, C.E. & McCourt, E.S. Detecting meaning in RSVP at 13 ms per picture. Atten Percept Psychophys 76, 270-279 (2014).
Bradford, W. Reaching the Visual Learner: Teaching Property Through Art. The Law Teacher 11(2004).