
Analysis In Your Control.
Trovomics provides a fast, no-code solution for multiple omics analyses, empowering scientists to easily and quickly analyze their own data.
No longer do you have to wait for others to analyze your data, you can do it yourself.
Customize your insights. No coding skills required.
Save time with an analysis platform built by scientists, for scientists.
Shorten the time to discovery.

Trovomics handles the upfront processing on our servers, so you can focus on your experimental results and interpretation. Using bulk RNA-Seq and ChIP-Seq, you can conduct your analysis with our automated pipelines, with no coding or scripting knowledge needed.
Put the power of exploration and visualization back into your own hands.

Our user-friendly platform is designed to:
Streamline your Seq analysis and visualization
Save time from coding
Empower you to analyze your own experiments
Create custom figures
Facilitate manuscript preparation with downloadable graphs and methods section
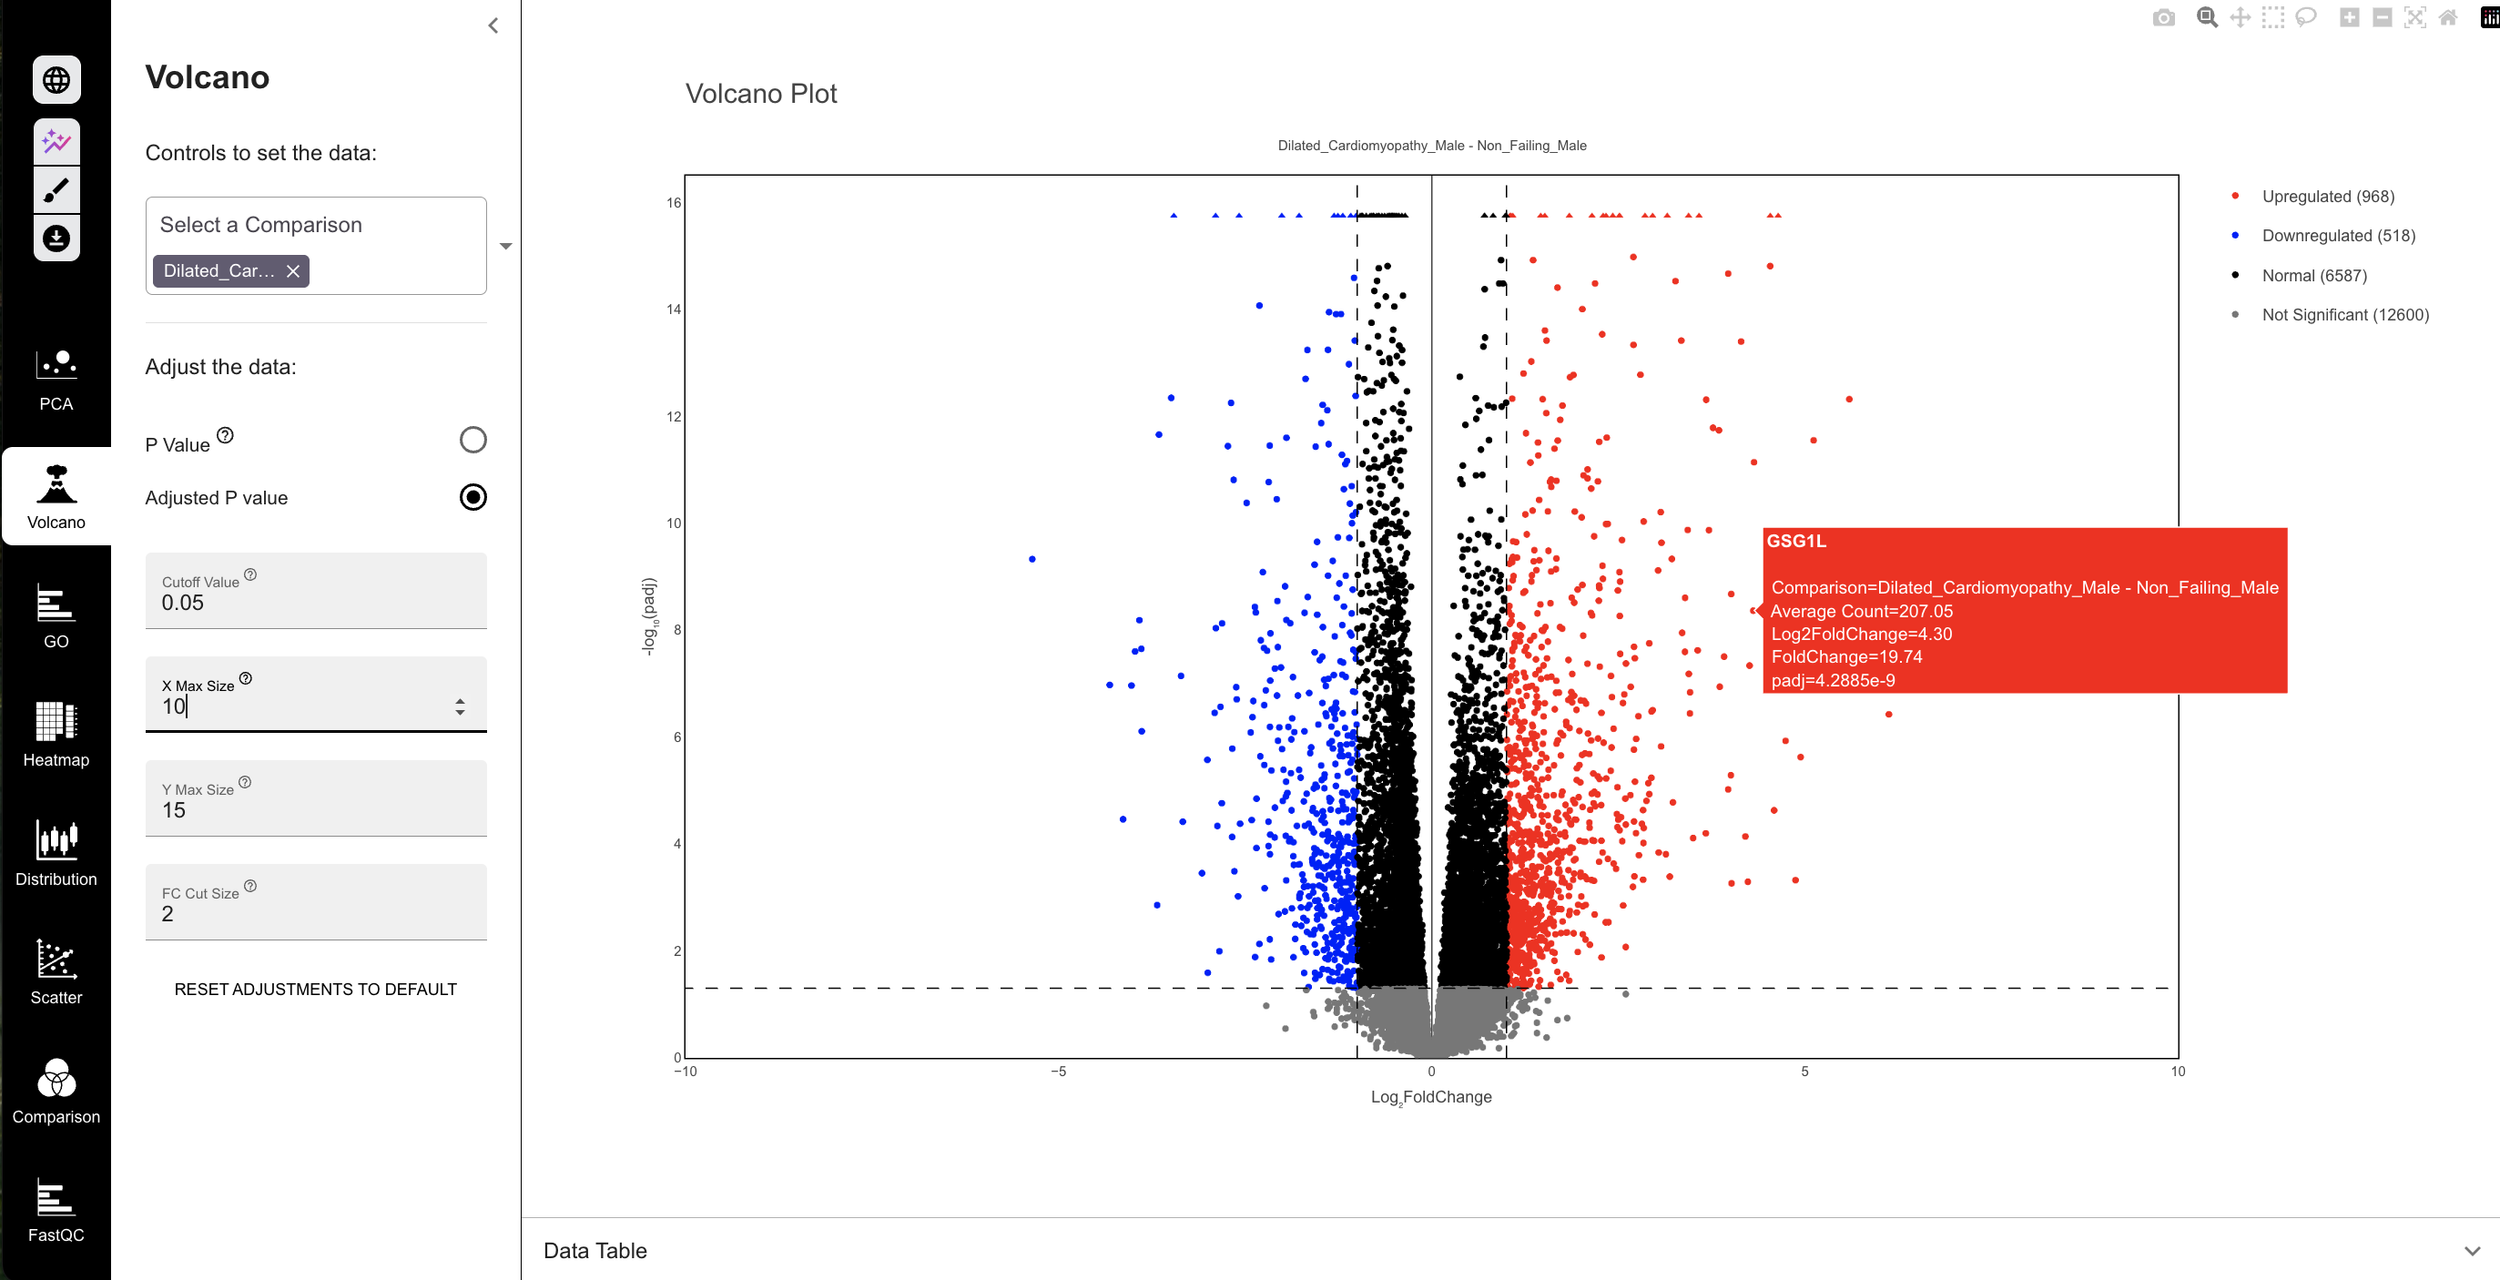
RNA-Seq Gene Ontology
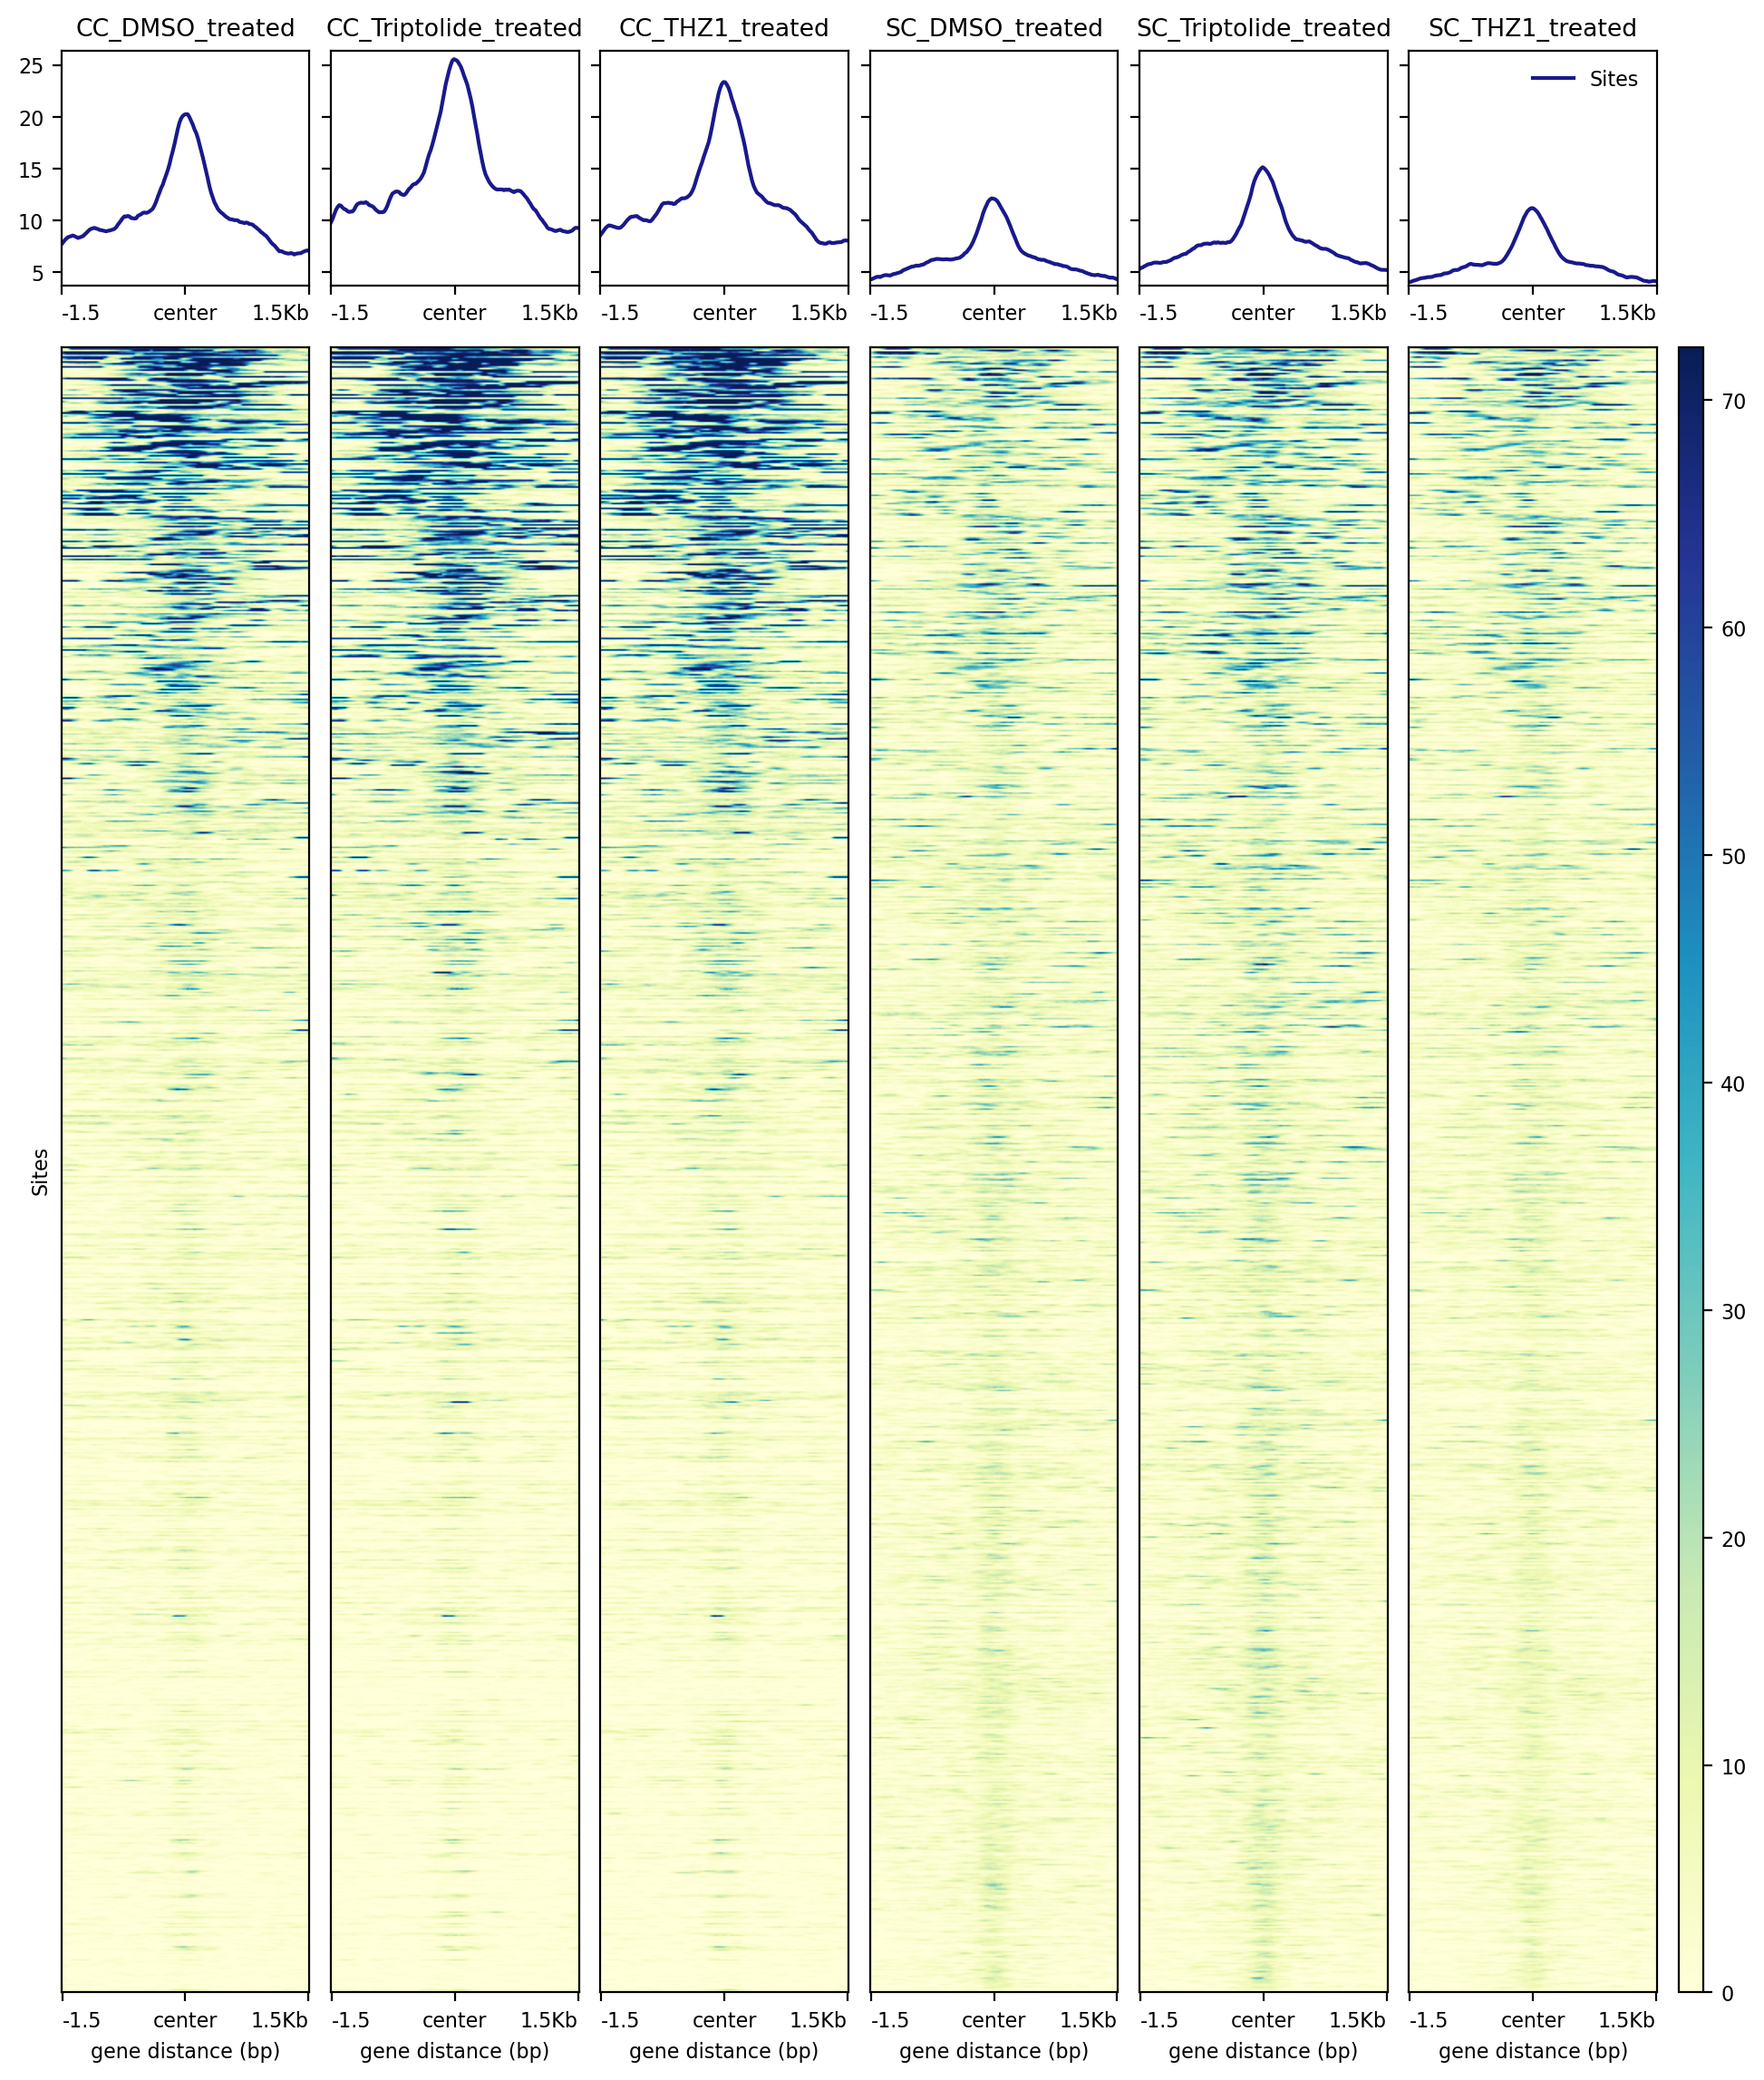
ChIP-Seq DBA Occupancy Heatmap

Built by scientists,
for scientists.
Trovomics is made by scientists, for scientists, to gain access to high-quality bioinformatics analysis. We were frustrated with existing structures and wanted a tool that could bypass the time-consuming manual processes of traditional analysis. So we built one.

When you need assistance, we’re here at every step.

Help Center
Self-service tools including bioinformatics resources, FAQs, and a product support team.
Ready to get started?
View full feature lists and plan comparisons on our Pricing page.
Full Analysis
$99/Month*
1 user
Unlimited analysis hours
Unlimited storage
RNA-Seq and ChIP-Seq analysis (automated data processing & interactive visualizations)
*billed as annual purchase
Demo
Free
1 user
View the platform to familiarize yourself with its functionality
Work with pre-loaded RNA-Seq and ChIP-Seq experiments, already analyzed
Adjust parameters in the visualizer to see how your graphs change