
RNA-Seq discovery made simple.
Home → Product
Find those RNA-Seq insights today.
It’s the Transcriptome that indicates what genes are expressing, and thereby, what cellular and biological processes are occurring. With Trovomics RNA-Seq analysis, you can find the outcomes of your experiment without waiting on someone else’s schedule.


Quality Control
Trim
Align
Quantify
Quality Control
Normalization
Differential Expression
Pathway Enrichment Analysis
Volcano Plot
Gene Ontology
Comparison
and more
Visualize your next RNA-Seq discovery the way you want.
Trovomics takes the guesswork out of building your RNA-Seq workflow. We implement a collection of industry-standard tools wrapped in our expertly designed pipeline for a streamlined experience. We detect your experimental design and guide you through a customizable analysis setup. This process ensures you get the most robust results, tailored to your data.

Principal Component Analysis
Show similarities between samples, change the size, and examine the influence of experimental conditions on samples.

Comparison
Compare lists of differentially expressed genes or create your own comparisons using custom gene lists.

Distribution Plot
Explore the distribution of a set of genes and see how that distribution is influenced by experimental conditions.

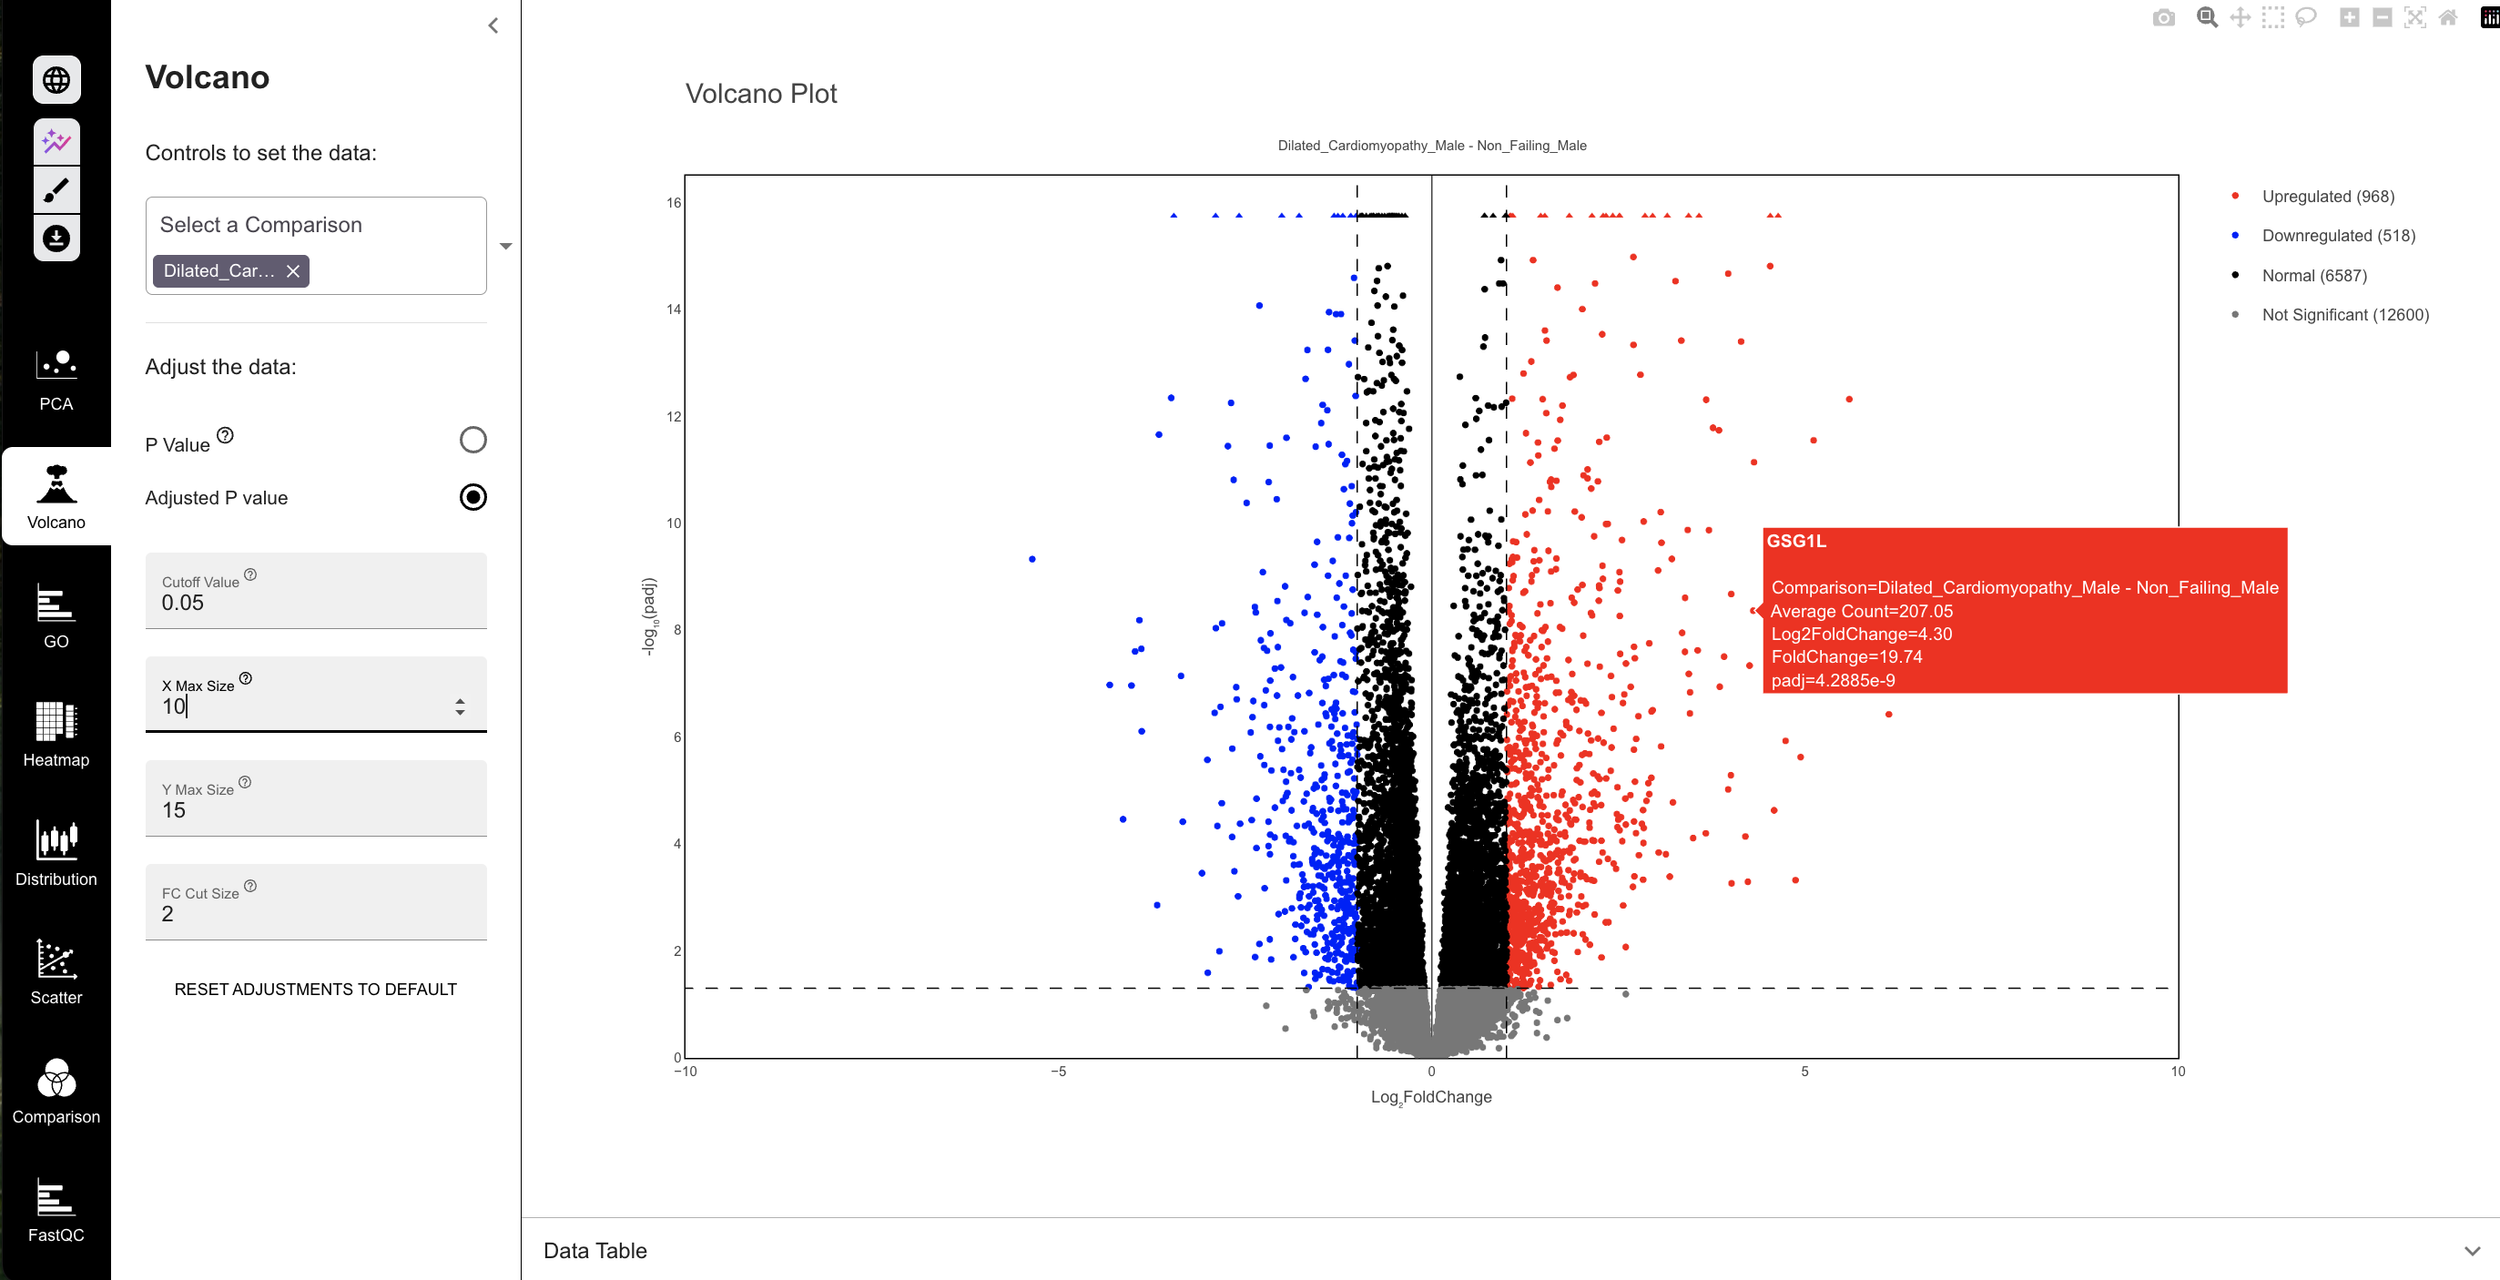
Volcano Plot
Visualize the magnitude and significance of differentially expressed genes.

Heatmap
Uncover patterns among genes and samples using various clustering methods.

Gene Ontology
Explore enrichment of Gene Ontology terms for differentially expressed genes.

Scatter Plot
Observe and identify relationships or patterns between variables.
Want to see the
visualizations in action?
The power to investigate your own data.
Use the Trovomics visualizer to explore your RNA-Seq data through interactive and customized graphs. Discover the most pertinent results from your sequencing data in any of our visualizations.
Everything you need for your next presentation or publication.
With Trovomics, you can export customized visualizations and automatically generated methods that clearly describe how each figure was created. Methods have already been created and can be downloaded.
Everything you need—made accessible like never before.
Key features:
Quickly perform additional analyses on data to target subsets of samples or genes
Easily download all files and images from analysis and visualization
Export methods for communicating pipeline methodology and graph generation

When you need assistance, we’re here at every step.
Help Center Access
Explore self-service options
in our Help Center
We’re committed to providing you the tools you need to analyze and understand your data, while also bridging knowledge gaps in the field of bioinformatics. That’s why we’ve created an information space that includes:
Bioinformatics Resources
FAQs
Support Access
Citing Trovomics in your manuscript
Citing software in scientific research is important for both scientists and the tools that they use.
By citing Trovomics in your research, you are helping to ensure its continued development and maintenance. You’re also helping to make it easier for other scientists to use the platform to conduct their research.

To cite Trovomics in publications use:
Raw sequencing data was analyzed and visualized using Rajant Health Incorporated’s Trovomics omics analysis service (www.trovomics.com).