
Explore epigenetics with ChIP-Seq.
Home → Product
Analyze your ChIP-Seq data yourself.
How proteins interact with the genome is the basis for Epigenetics, and Chromatin ImmunoPrecipitation Sequencing (ChIP-Seq) is the analysis to give you those results. Proteins, such as Transcription Factors, are a key factor in determining what genes are expressed, and thereby, the biological processes in your experiment.
ChIP-Seq plots the way you want to see them.
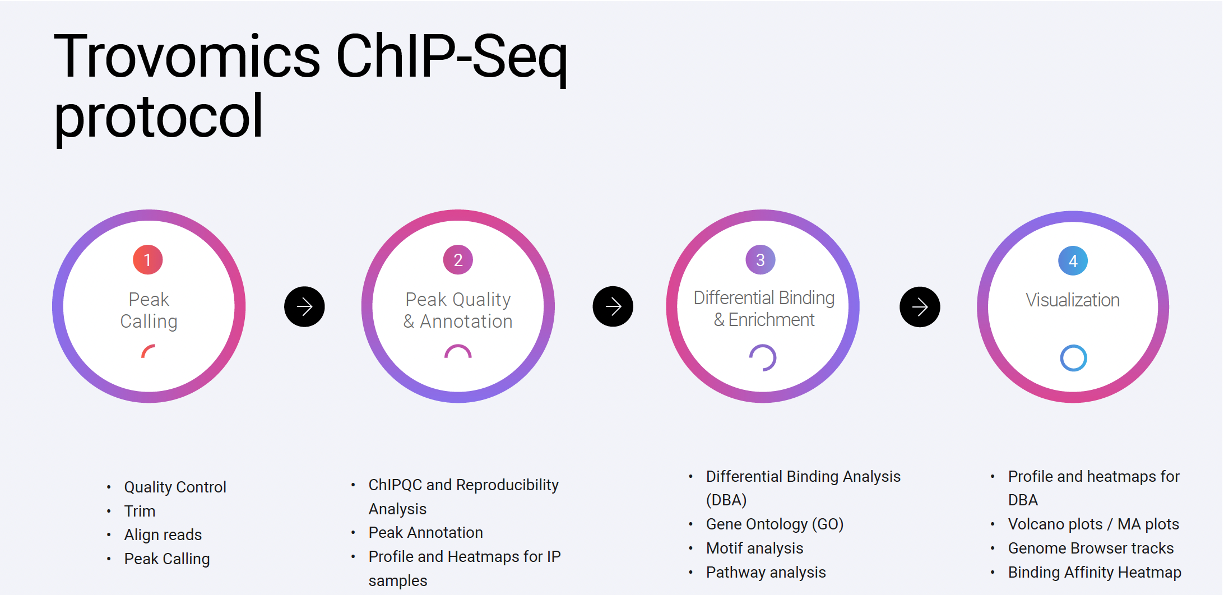
Trovomics takes the guesswork out of building your ChIP-Seq workflow. We implement a collection of industry-standard tools wrapped in our expertly designed pipeline for a streamlined experience. Our platform guides you through a customizable analysis setup, ensuring robust, high-quality results tailored to your data.

Principal Component Analysis
Reveal similarities and differences between ChIP-seq samples by visualizing genome-wide signal variation. Assess how experimental conditions drive sample clustering.

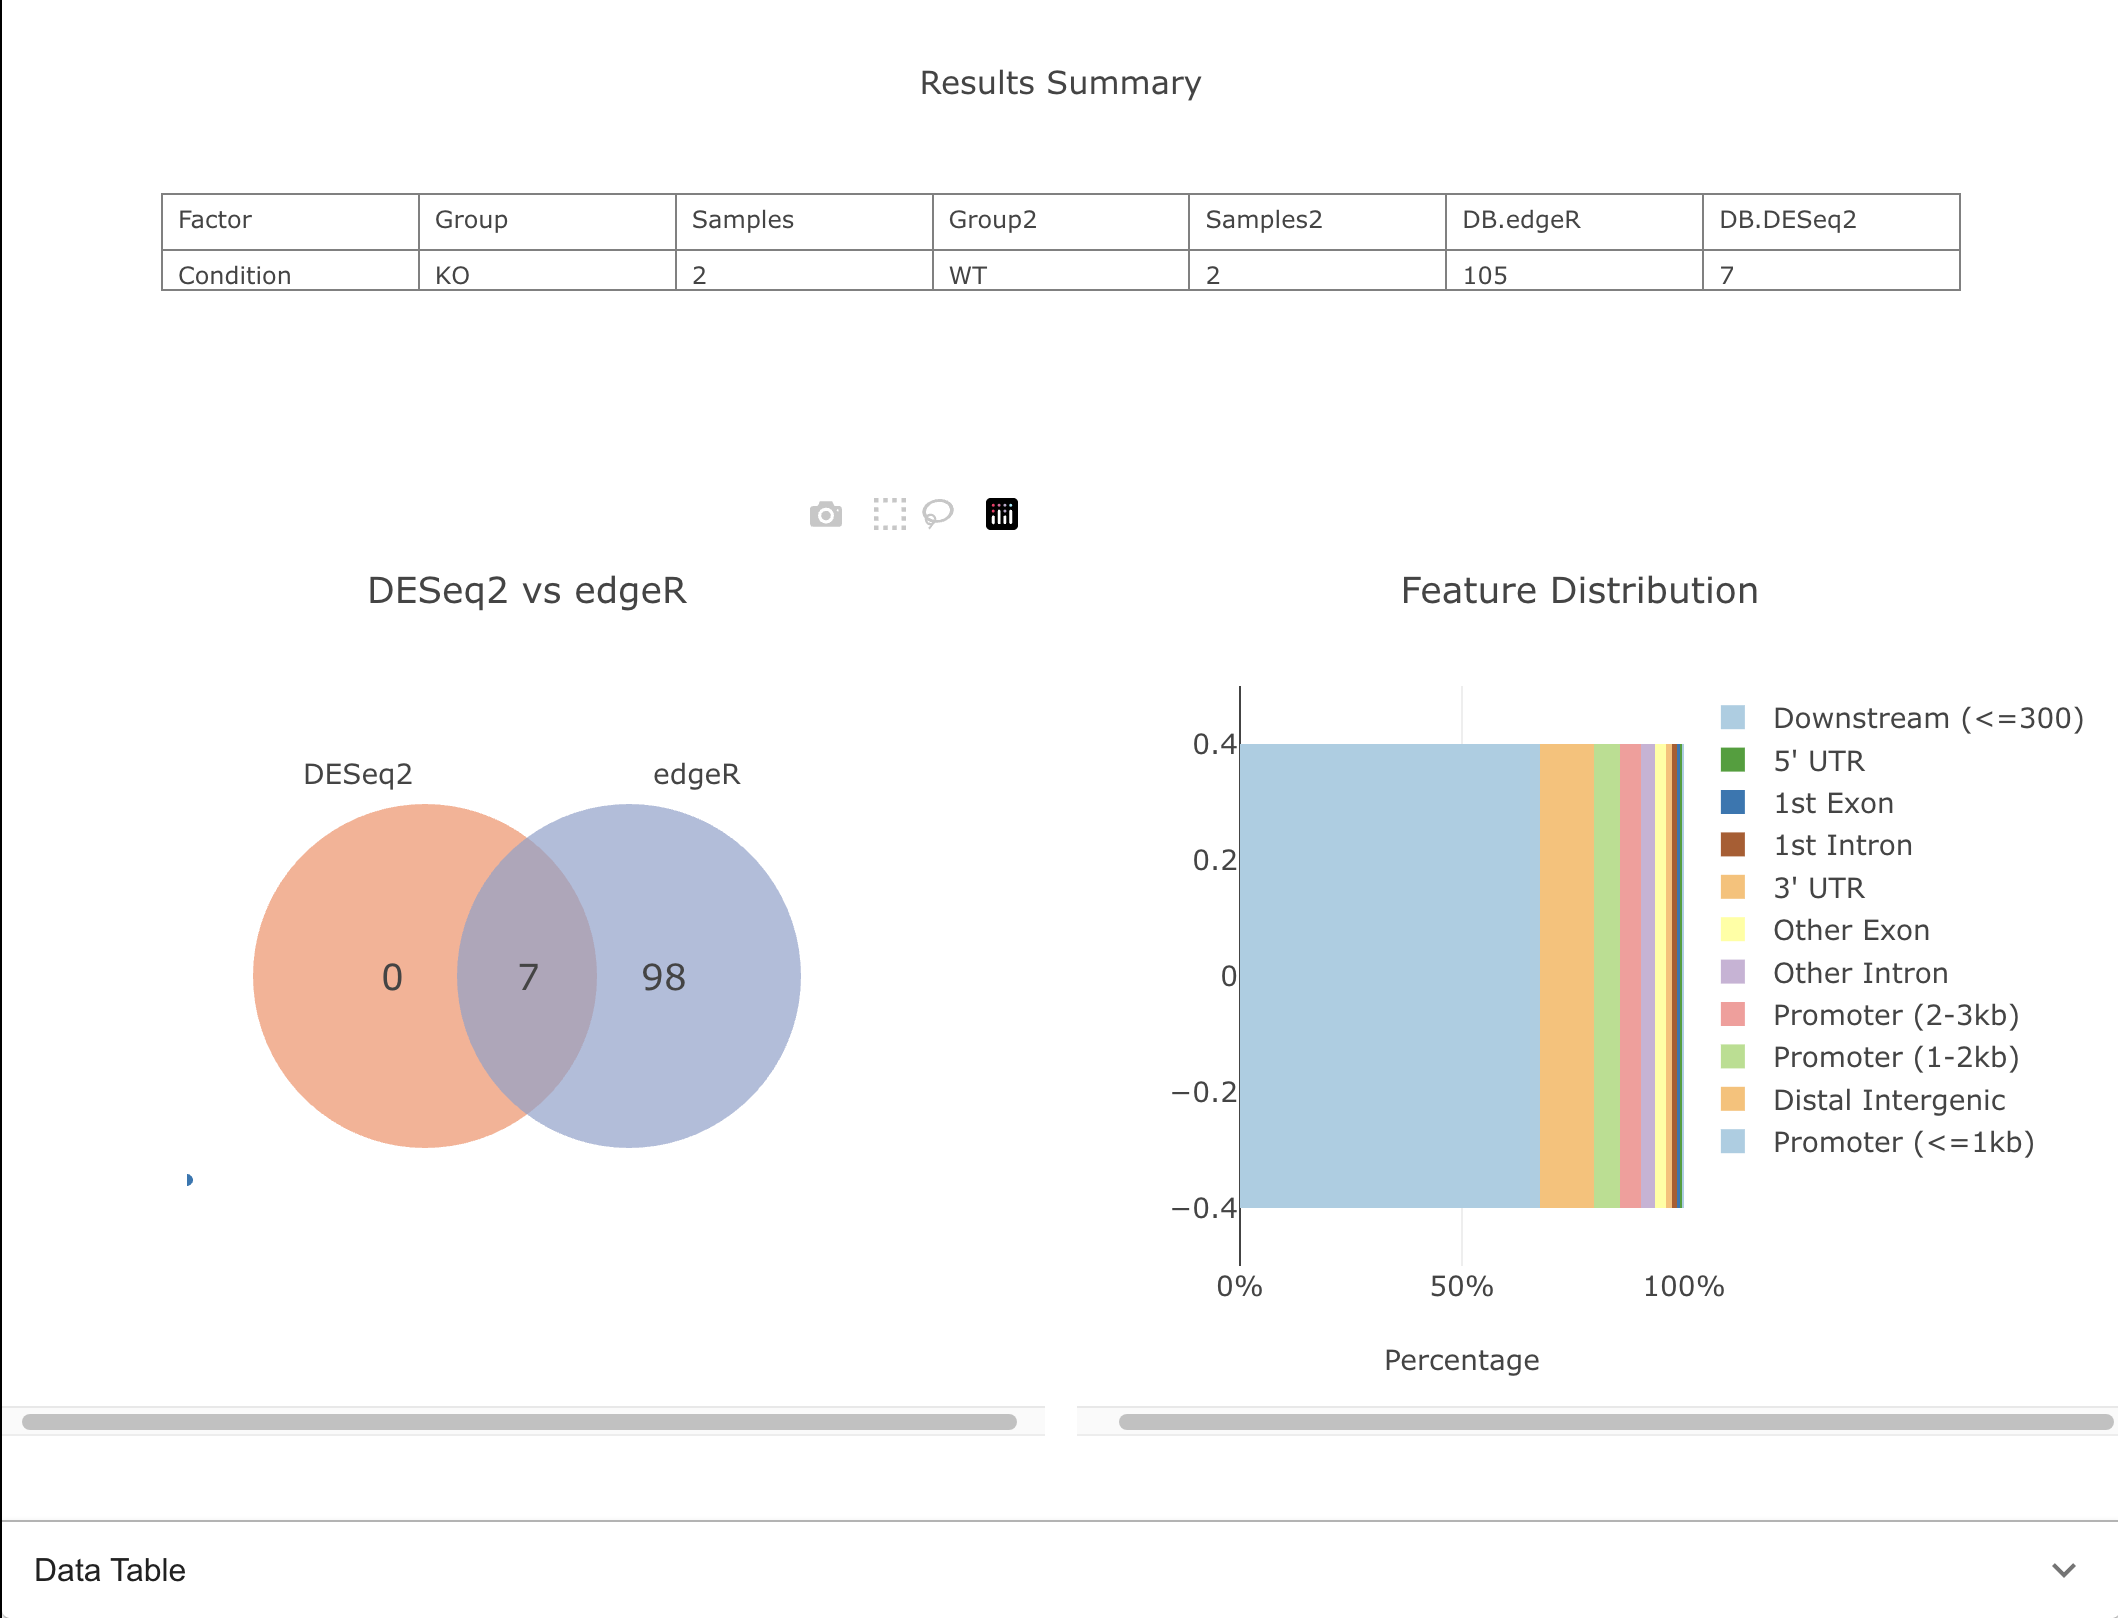
Comparison
Compare differential binding results from multiple statistical approaches, highlighting shared and unique significant peaks.

Feature Distribution Plot
Show the distribution of peaks across genomic features and compare annotation profiles between samples.

Volcano Plot
Display fold enrichment and statistical significance of differential binding regions. Quickly spot peaks with the strongest condition-specific increases or decreases in signal.

Heatmap
Visualize signal intensity across sets of genomic regions, highlighting binding patterns, co-enrichment, and clustering among samples or peak groups.

Gene Ontology
Explore functional enrichment for genes associated with differential peaks or annotated regions, revealing biological processes linked to changes in binding.
Want to see the
visualizations in action?

Profiles & Heatmaps
Visualize signal enrichment patterns with heatmaps and profile plots, revealing region-specific and averaged signals across samples.
The power to investigate your own data.
Use the Trovomics visualizer to explore your ChIP-Seq data through interactive and customized graphs. With our analyses, get your Enrichment, Heatmap and Profile plots to find the insights into your experiment. When you need to reevaluate based on these insights, just change your parameters and generate new plots. No need to wait on someone else to change the scripts.
Everything you need for your next presentation or publication.
With Trovomics, you can export customized visualizations and automatically generated methods that clearly describe how each figure was created. Methods have already been created and can be downloaded.
Everything you need—made accessible like never before.
Key features:
Quickly perform additional analyses on data to target subsets of samples or genes
Easily download all files and images from analysis and visualization
Export methods for communicating pipeline methodology and graph generation

When you need assistance, we’re here at every step.
Help Center Access
Explore self-service options
in our Help Center
We’re committed to providing you the tools you need to analyze and understand your data, while also bridging knowledge gaps in the field of bioinformatics. That’s why we’ve created an information space that includes:
Bioinformatics Resources
FAQs
Support Access
Citing Trovomics in your manuscript
Citing software in scientific research is important for both scientists and the tools that they use.
By citing Trovomics in your research, you are helping to ensure its continued development and maintenance. You’re also helping to make it easier for other scientists to use the platform to conduct their research.

To cite Trovomics in publications use:
Raw sequencing data was analyzed and visualized using Rajant Health Incorporated’s Trovomics omics analysis service (www.trovomics.com).